Research Article | | Peer-Reviewed

Evaluation of Vegetation Conditions for Green Legacy Using Geospatial Technology: A Case of Entoto Natural Park, Addis Ababa, Ethiopia

Received: 9 December 2025     Accepted: 22 December 2025     Published: 2 February 2026
Views:       Downloads:
Abstract

Monitoring vegetation condition is essential for ecological sustainability, restoration planning, and climate change adaptation, particularly in urban-adjacent conservation areas such as Entoto Natural Park in Addis Ababa, Ethiopia. However, vegetation condition assessments in the park have been limited and lack quantitative evidence based on geospatial approaches. This study evaluates natural vegetation conditions using multispectral remote sensing, spectral indices, and a Random Forest machine learning model. Landsat imagery from 1995, 2005, 2015, and 2025 was processed to generate NDVI, GNDVI, and NDWI indices, which were used to classify vegetation health and analyze temporal trends. The Random Forest classifier was trained using field-based reference samples and validated using out-of-bag accuracy metrics. Results indicate a general improvement in vegetation condition between 1995 and 2025, with higher chlorophyll content and water availability in recently rehabilitated areas, while eucalyptus-dominated zones exhibited comparatively lower moisture and greenness values. The prediction model also forecasted future vegetation conditions, suggesting continued improvement under ongoing restoration programs. This study demonstrates the effectiveness of spectral indices combined with machine learning for vegetation condition monitoring and provides a geospatial foundation to support sustainable management and restoration efforts under Ethiopia’s Green Legacy Initiative.

Published in Engineering Science (Volume 11, Issue 1)
DOI 10.11648/j.es.20261101.11
Page(s) 1-17
Creative Commons

This is an Open Access article, distributed under the terms of the Creative Commons Attribution 4.0 International License (http://creativecommons.org/licenses/by/4.0/), which permits unrestricted use, distribution and reproduction in any medium or format, provided the original work is properly cited.

Copyright

Copyright © The Author(s), 2026. Published by Science Publishing Group

Keywords

Entoto Natural Park, GNDVI, NDVI, NDWI, Random Forest, Remote Sensing, Spectral Indices, Vegetation Condition

1. Introduction
1.1. Background of the Study
Vegetation condition is an essential indicator of ecosystem health, as it reflects plant vigor, moisture status, and overall ecological stability . In rapidly urbanizing environments such as Addis Ababa, surrounding highland ecosystems are increasingly exposed to pressures including deforestation, settlement expansion, fuelwood extraction, and grazing . Over the past decades, large portions of the park have been dominated by eucalyptus plantations, which alter soil moisture and affect native species regeneration. At the same time, national and local restoration initiatives such as the Green Legacy Program and community-based rehabilitation efforts have been implemented to reverse the degradation . However, the degree to which these interventions have improved vegetation condition remains insufficiently assessed. Most existing studies on Entoto Natural Park focus on land-cover change detection rather than on evaluating the condition of vegetation, such as greenness, chlorophyll content, and water status . As a result, there is limited scientific evidence describing the spatial variability, trends, and current state of vegetation condition in the park. Spectral indices derived from satellite data, including the Normalized Difference Vegetation Index (NDVI), Green NDVI (GNDVI), and Normalized Difference Water Index (NDWI), provide efficient quantitative measures of vegetation health . When combined with machine learning approaches such as Random Forest, these indices offer a powerful means to assess vegetation condition across space and time. Therefore, a systematic evaluation of vegetation condition using these tools is essential to understand ongoing ecological changes in Entoto Natural Park, assess the effectiveness of restoration efforts, and support future management planning.
1.2. Statement of the Problem
Natural vegetation in Entoto Natural Park has been highly influenced by human pressure, urban expansion, and the domi-nance of eucalyptus plantations, resulting in variation in vegetation condition across the landscape . Although restoration and rehabilitation activities have recently been implemented under the Green Legacy Initiative, the current vegetation condition and its temporal changes have not been adequately quantified. . Previous studies in the area have mainly focused on land cover change detection and general forest cover analysis, with limited attention to vegetation condition, moisture status, and chlorophyll content. Moreover, most existing assessments do not incorporate spectral indices such as NDVI, GNDVI, and NDWI, nor do they apply machine learning approaches to classify vegetation condition or predict future trends. The absence of a detailed, spectral-index-based vegetation condition assessment creates a gap in understanding the ecological state of Entoto Natural Park and limits evidence-based restoration planning. Therefore, a scientifically grounded evaluation of vegetation condition using multispectral data and Random Forest modeling is needed to support effective ecosystem management in the park. The aim is to evaluate vegetation conditions in Entoto Natural Park during dry and wet seasons using multispectral satellite imagery and spectral indices and predict vegetation condition using Random Forest outputs and spectral index trajectories.
2. Methods and Materials
2.1. Geographic Location
Entoto Natural Park is located between 38° 48'00'' and 38° 47'01'' East and 09°4 '5'' and 09°07'33'' North. The Park is located on the south-eastern slopes of Mount Entoto between the northern border of the city of Addis Ababa (2,600 m) and the ridge (over 3,100 m). Its total area is 2300 hectares. However, the total area of the Entoto slope together with the Entoto Natural Park is 1300 ha .
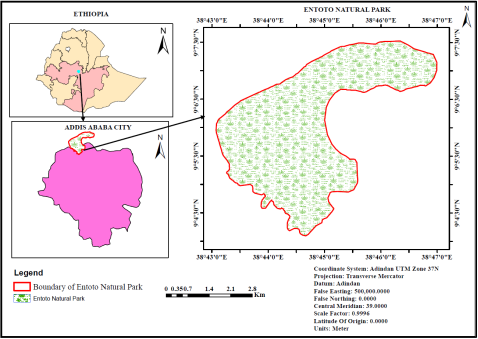
Figure 1. Location map of the study area.
2.2. Data Source and Material
2.2.1. Data Source
Table 1. Data used and its sources.

No

Satellite

Sensor

Spatial Resolution

Acquisition Dates Used

Season

Source

1

Landsat 5

TM

30 m

Jan–Feb & Aug–Sep (1995)

Dry & Wet

USGS Earth Explorer

2

Landsat 7

ETM+ (SLC-on)

30 m

Jan–Feb & Aug–Sep (2005)

Dry & Wet

USGS Earth Explorer

3

Landsat 8

OLI

30 m

Jan–Feb & Aug–Sep (2015)

Dry & Wet

USGS Earth Explorer

4

Landsat 8

OLI

30 m

Jan–Feb & Aug–Sep (2025)

Dry & Wet

USGS Earth Explorer

2.2.2. Software Used
Table 2. Software used.

Software

Version

Purpose in the Study

ENVI

5.3

Landsat image pre-processing (layer stacking, calibration), Computation of NDVI, GNDVI, NDWI, Supervised classification using Random Forest, Accuracy assessment (confusion matrix, overall accuracy)

ArcGIS

10.8

Spatial data management and clipping, Map production and layout, Overlay and extraction of values, Visualization of vegetation condition maps

Google Earth Pro

Latest

Identification of ground truth points, Visual verification of land cover, Support for training data selection

Microsoft Excel

2016+

Organizing and storing accuracy metrics, Managing XYZ ground truth tables, Summarizing classification statistics

Microsoft Word

2016+

Writing, editing, and formatting the thesis document, Preparing tables, figures, and final layout

2.2.3. Variables and Indicators
Table 3. Indicators of the selected variables for evaluation of vegetation condition in Entoto Natural Park.

S. No

Variables

Indicators

1

Vegetation leaf water moisture

Values of Normalized Difference Water Index (NDWI)

2

Vegetation chlorophyll Concentration

Values of Normalized Difference Chlorophyll Index (NDCI)

3

Vegetation health status

Values of Normalized Difference Vegetation Index (NDVI)

2.3. Method of Data Analysis
The Landsat images were first pre-processed in ENVI 5.3, where layer stacking, atmospheric correction, cloud masking, and sub setting to the park boundary were performed to prepare the datasets for analysis. After pre-processing, three spectral indices NDVI, GNDVI, and NDWI were computed from the surface reflectance bands in order to quantify vegetation greenness, chlorophyll-related reflectance, and water content. These indices provided essential input layers for subsequent classification. Training and validation samples were prepared using stratified sampling supported by high-resolution Google Earth imagery and field-based reference points. The Random Forest algorithm was then applied in ENVI 5.3 as the main supervised classification approach to categorize vegetation condition for each study year. Following classification, an accuracy assessment was conducted using independent validation samples.
Derivation of Normalized Difference Water Index (NDWI)
To achieve the first specific objective of this study, Normalized Difference Water Index was used. developed the Normalized Difference Water Index (NDWI) for determination of vegetation water content based on physical principles.
NDWI = (NIR – SWIR) / (NIR + SWIR)(1)
The NDWI product is dimensionless and varies between -1 to +1, depending on the leaf water content but also on the vegetation type and cover. High values of NDWI correspond to high vegetation water content and to high vegetation fraction cover . Low NDWI values correspond to low vegetation water content and low vegetation fraction cover. In period of water stress, NDWI will decrease.
Estimating Green Normalized Difference Chlorophyll Index (GNDVI)
To achieve the second specific objective of this study, GNDVI (Green Normalized Difference Vegetation Index) was derived from satellite imagery. GNDVI is modified version of NDVI to be more sensitive to the variation of chlorophyll content in the vegetation. GNDVI spectral index has the capability to identify different concentration rates of chlorophyll .
GNDVI = (NIR-GREEN) /(NIR+GREEN)(2)
Derivation of Normalized Difference Vegetation Index (NDVI)
To achieve the third specific objective of this study, Normalized Difference Vegetation Index (NDVI) was used. According to , the reason NDVI relates to vegetation is that, the one which is well vegetated reflects better in the near infrared part of the spectrum. The value of NDVI is between -1 and 1. Normalized difference vegetation index (NDVI) was acquired from spectral reflectance measurements in the visible (RED) and near infrared regions (NIR) in the ArcGIS environment .
The index was defined by the following equation.
NDVI = NIR-RED/NIR+RED(3)
NDVI is driven by perceived vegetation, which is the difference between the NIR and the red zone. Very low NDVI values (-1 to 0) describes dead plants .
Figure 2. Methodological Scheme of the Study.
Low NDVI values (0-0.33) represent diseased pant or vegetation. Moderate values (0.33 – 0.66) describe moderately healthy green vegetation. While high values (0.66-1) describe very healthy green vegetation. NDVI values closest to 0 shows bare soil and while negative NDVI value is for water body .
3. Result and Discussion
3.1. Leaf Moisture Content of Vegetation in Dry and Wet Season
3.1.1. Leaf Moisture Content of Vegetation in Dry Season
This analysis was conducted through the derivation of the Normalized Difference Water Index (NDWI), a spectral index sensitive to vegetation moisture. The results revealed that Eucalyptus trees, which dominate the vegetation cover in Entoto Natural Park, exhibit comparatively low leaf moisture levels. A noticeable variation in NDWI values was identified across the four reference years—1995, 2005, 2015, and 2025. In 1995, the NDWI values ranged from a minimum of -0.081 to a maximum of 0.618.
By 2005, the NDWI values ranged from -0.138 to 0.438, showing a decline in maximum NDWI compared to 1995. This reduction suggests a decrease in leaf water content in the vegetation, implying that the vegetation was drier in 2005 than in 1995. The trend continues through 2015 and 2025, reflecting temporal variation and possibly the influence of climate and land use changes.
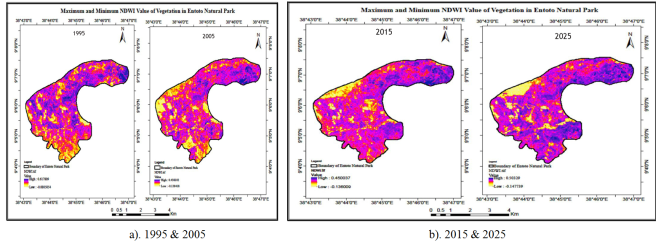
Figure 3. NDWI values of vegetation during the dry season.
In 2015, the NDWI ranged from a minimum of -0.136 to a maximum of 0.450. In contrast, for 2025, the NDWI values ranged from -0.148 to 0.503. This comparison suggests that the vegetation in 2025 exhibited higher leaf moisture content than in 2015, indicating a possible improvement in water availability or vegetation health during that period.
Table 4. NDWI values of vegetation during dry season.

Year

NDWI Value

Minimum

Maximum

1995

-0.081

0.618

2005

-0.138

0.438

2015

-0.136

0.450

2025

-0.148

0.503

Table 5. NDWI value categories with its description.

NDWI Categories

Description

0.7 <=NDWI

Very high moisture content

0.6 <=NDWI <0.7

High moisture content

0.6 <=NDWI <0.5

Moderate moisture content

0.4 <= NDWI<0.5

Low moisture content

0.3 <=NDWI <0.4

Weak drought

0.2 <=NDWI<0.3

Moderate drought

0<=NDWI<0.2

Strong drought

NDWI<0

Very Strong drought

According to the findings of this study, the vegetation in Entoto Natural Park showed low NDWI values during the dry season. This suggests that the vegetation had low moisture content in its leaves during this time, and it indicates a positive relationship between NDWI values and leaf moisture. High NDWI values indicate high leaf moisture in the vegetation, while low NDWI values suggest low water content or moisture in the leaves of the vegetation in Entoto Natural Park.
The dark green vegetation in Entoto Natural Park displayed relatively high NDVI and NDWI values. High NDVI values indicate a healthy state of vegetation, while high NDWI values indicate the presence of abundant leaf moisture. Therefore, vibrant and healthy green vegetation in the park has a high amount of water content or moisture in its leaves, whereas infected or damaged vegetation signifies a low level of leaf moisture in study area.
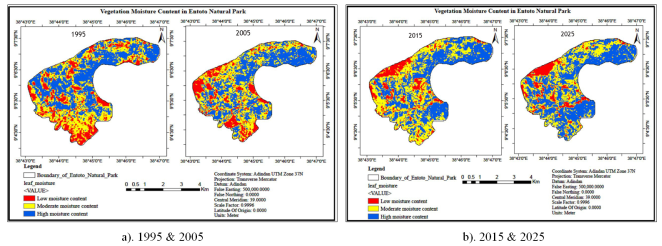
Figure 4. Vegetation moisture content in Entoto Natural Park during dry season.
The results revealed that the eucalyptus trees exhibited very low leaf water content during the dry season. This suggests that these trees face challenges in maintaining adequate hydration levels when water availability is limited. In contrast, other vegetation types in the study area demonstrated relatively higher leaf water moisture levels during the same period. The lower leaf water content of the eucalyptus trees could be attributed to their physiological characteristics and adaptations.
Furthermore, the study also found that the eucalyptus trees exhibited moderate chlorophyll concentration during the dry season. Chlorophyll is essential for photosynthesis, the process through which plants convert sunlight into energy. The moderate chlorophyll concentration indicates that the eucalyptus trees were still able to perform photosynthesis, albeit at a slightly reduced rate compared to other vegetation types. Overall, the findings suggest that eucalyptus trees in Entoto Natural Park have specific adaptations to cope with dry conditions, including lower leaf water content and moderate chlorophyll concentration. These findings contribute to our understanding of the ecological dynamics and adaptations of the dominant vegetation in the park, providing valuable insights for its management and conservation.
3.1.2. Leaf Moisture Content of Vegetation in Wet Season
Leaf water content is one of the most common physiological parameters limiting the efficiency of vegetation productivity, including Eucalyptus trees. The calculated minimum and maximum values of the NDWI spectral index during wet season for the year 1995 are -0.074 and 0.630, respectively. A high value of NDWI indicates Eucalyptus trees with high moisture content or less water stress, while a low NDWI represents Eucalyptus trees with low leaf moisture or high-water stress. The minimum and maximum NDWI spectral index values of vegetation during wet season for the year 2005 are -0.165 and 0.745, respectively. The maximum NDWI value of vegetation calculated for 2005 is relatively higher than that of 1995, indicating that the vegetation leaf moisture content in 1995 was relatively lower than in 2005. This progression suggests an increase in vegetation leaf water content or decrease in vegetation water stress in 2005.
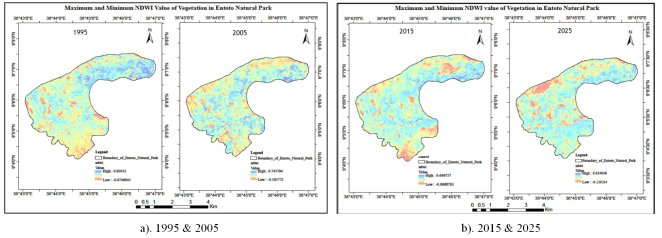
Figure 5. NDWI values of vegetation during wet season.
The values of the NDWI spectral index during the wet season for all observed years were varied. In 2015, the minimum and maximum NDWI were -0.067 and 0.667 respectively, and for the year 2025, the calculated minimum and maximum values of NDWI were -0.139 and 0.634. This shows that the leaf water content of Eucalyptus trees in 2015 was relatively higher than that of 2025, indicating a decreased amount of Eucalyptus tree leaf moisture with increased leaf water stress in 2025.
Table 6. The NDWI Values.

Year

NDWI Values

Minimum

Maximum

1995

-0.074

0.630

2005

-0.165

0.745

2015

-0.067

0.667

2025

-0.139

0.634

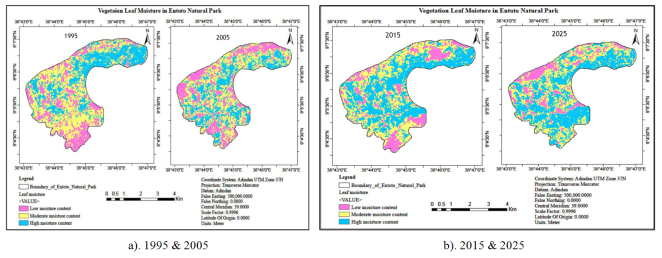
Figure 6. Vegetation leaf moisture in Entoto Natural Park during wet season.
During the wet season in Entoto Natural Park, the NDWI (Normalized Difference Water Index) values of the vegetation showed an increase. This indicates that the leaf moisture content of the vegetation in the study area is relatively high during this period. The increased NDWI values suggest that the vegetation in Entoto Natural Park has a higher water content in its leaves during the wet season. This is primarily due to the availability of sufficient rainfall, which provides a consistent supply of water to the plants. As a result, the plants are able to maintain their leaf moisture levels, leading to healthier and more vibrant vegetation.
Furthermore, high leaf moisture content helps to regulate temperature within the plant tissues, preventing overheating and reducing the risk of heat stress. It also contributes to the overall resilience of the vegetation, making it more resistant to drought conditions that may occur later in the dry season. Overall, the increased NDWI values during the wet season indicate that the vegetation in Entoto Natural Park is well-adapted to the seasonal changes and able to thrive in the presence of abundant moisture, resulting in healthier and more robust plant growth.
3.2. Chlorophyll Concentration of Vegetation in Dry and Wet Season
3.2.1. Chlorophyll Concentration of Vegetation in Dry Season
The chlorophyll concentration of vegetation in Entoto Natural Park during the dry season was analysed based on the GNDVI spectral index. The results reveal that the dominant vegetation in the study area has relatively low chlorophyll concentration.
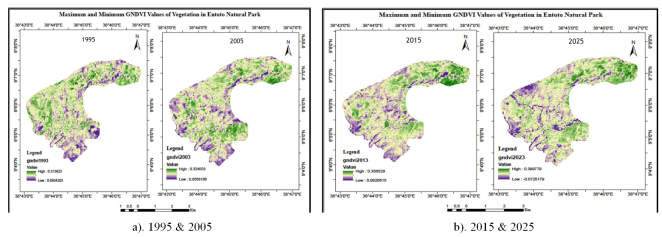
Figure 7. Map of the maximum and minimum GNDVI values of vegetation in Entoto Natural Park during dry season.
Table 7. Maximum and minimum GNDVI values of vegetation during dry season.

Year

GNDVI Value

Minimum

Maximum

1995

0.093

0.314

2005

0.056

0.325

2015

0.082

0.357

2025

-0.073

0.4

There is some variation in GNDVI values from 1995 to 2005 in Entoto Natural Park. The minimum and maximum values of GNDVI for 1995 are 0.093 and 0.314, respectively. A high GNDVI value indicates an area of vegetation with high chlorophyll concentration. For the year 2005, the minimum and maximum GNDVI values of vegetation were 0.056 and 0.325, respectively. The maximum GNDVI value obtained in 2005 was relatively higher than that of 1995, indicating an increase in vegetation chlorophyll concentration in 2005.
Figures 4-9 also displays the maximum and minimum GNDVI values of vegetation for the observed years in Entoto Natural Park during the dry season. The values of GNDVI for all observed years were different. In 2015, the minimum and maximum GNDVI values were 0.082 and 0.325, respectively. For the year 2025, the obtained minimum and maximum GNDVI values were -0.073 and 0.4. This indicates that the chlorophyll concentration of vegetation in 2025 was relatively higher than that of 2015, suggesting an increase in chlorophyll concentration during the dry season in 2025.
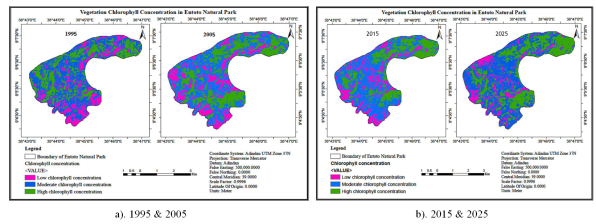
Figure 8. Map of vegetation chlorophyll concentration in Entoto Natural Park during dry season.
The findings revealed that the eucalyptus trees exhibited relatively low GNDVI values during the dry season, indicating a lower chlorophyll concentration compared to other vegetation types. Therefore, the lower chlorophyll concentration suggests reduced photosynthetic activity in the eucalyptus trees and other dominant vegetation during the dry season.
The decreased photosynthetic activity during the dry season can be attributed to the limited water availability in the environment. Water is crucial for various physiological processes in plants, including the production of chlorophyll and the efficient functioning of photosynthesis. When water is scarce, plants often undergo physiological adaptations to conserve water, such as reducing their photosynthetic activity and chlorophyll production.
These findings provide valuable insights into the overall health and vitality of the vegetation in Entoto Natural Park during different seasons. They highlight the significant impact of water availability on plant physiology and emphasize the importance of understanding these dynamics for effective conservation and management of natural ecosystems. By considering the water requirements and adaptations of dominant vegetation, such as eucalyptus trees, land managers can make informed decisions to maintain and enhance the health of vegetation in the park, promoting its ecological stability and biodiversity.
3.2.2. Chlorophyll Concentration of Vegetation in Wet Season
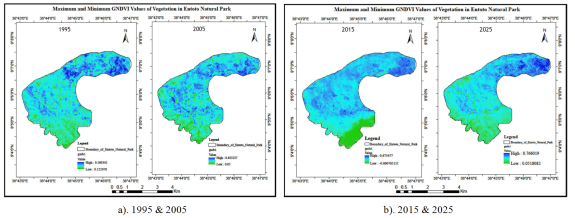
Figure 9. Map of the minimum and maximum GNDVI of vegetation in Entoto Natural Park during wet season.
The study analysed the chlorophyll concentration of vegetation during the wet season by calculating GNDVI from multispectral satellite imagery. The results indicate that the dominant vegetation, Eucalyptus trees, have high chlorophyll concentration during the wet season. The study found variations in GNDVI values for each year during the wet season. For example, in 1995, the minimum and maximum GNDVI values were 0.122 and 0.560 respectively. The higher GNDVI value indicates vegetation with higher chlorophyll concentration, while a lower GNDVI value represents vegetation with lower chlorophyll concentration. In 2005, the maximum GNDVI value was relatively higher than in 1995, indicating an increase in chlorophyll concentration.
Table 8. The GNDVI values of vegetation in Entoto Natural Park during wet season.

Year

GNDVI Values

Minimum

Maximum

1995

0.122

0.560

2005

0.050

0.653

2015

-0.001

0.673

2025

0.051

0.766

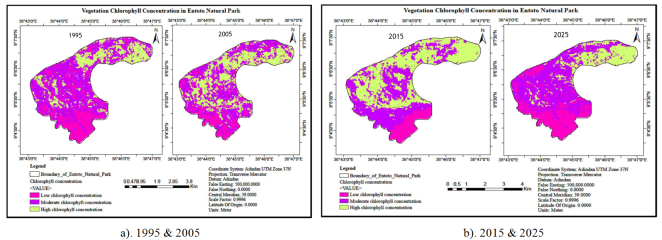
Figure 10. Map of vegetation chlorophyll concentration in Entoto Natural Park during wet season.
The lower chlorophyll concentration in eucalyptus trees suggests potential differences in their physiological characteristics compared to other types of vegetation in the park. Eucalyptus trees have unique adaptations that allow them to thrive in various environments, including their ability to tolerate drought conditions. However, this adaptation might come at the cost of reduced chlorophyll production, resulting in lower photosynthetic activity. Several factors could contribute to the lower chlorophyll concentration in eucalyptus trees. One possibility is that eucalyptus trees have evolved to allocate resources differently, prioritizing other physiological processes over chlorophyll production. This could be an adaptive strategy to cope with specific environmental conditions or to optimize resource utilization.
Additionally, the lower chlorophyll concentration in eucalyptus trees may also be influenced by their natural growth patterns and life cycle. Different species of vegetation have varying requirements for chlorophyll production, and it is possible that eucalyptus trees have naturally lower chlorophyll levels as part of their growth and development. The eucalyptus trees in Entoto Natural Park exhibited a lower chlorophyll concentration compared to other types of vegetation. Chlorophyll is a pigment found in plants that plays a crucial role in photosynthesis, the process by which plants convert sunlight into energy. It captures light energy and facilitates the production of glucose, which fuels plant growth and development. Understanding the differences in chlorophyll concentration between eucalyptus trees and other types of vegetation provides insights into the unique characteristics and adaptations of these trees. It highlights the diverse strategies that different plant species employ to survive and thrive in their respective environments.
3.3. Vegetation Health Status in Dry and Wet Seasons
3.3.1. Vegetation Health Status in Dry Season
The vegetation health status in Entoto Natural Park was examined through driving NDVI from multi-spectral satellite imagery during dry season. The result of the study reveals that the dominant vegetation in the study area has relatively low NDVI values during dry season. Since the dominant vegetation in Entoto Natural Park is Eucalyptus tree, the analysed vegetation NDVI value characterizes the Eucalyptus health status during dry season.
There is some variation of NDVI values from the year 1995 to 2005 in Entoto Natural Park during dry season. The minimum and maximum values of NDVI for the year 1995 are -0.001 and 0.668 respectively. The high value of NDVI shows the area of vegetation with good health status and low NDVI represents the area of vegetation with relatively low health status. The minimum and maximum NDVI values of vegetation for the years 2005 are 0.062 and 0.541 respectively. The maximum NDVI value of vegetation which was obtained in 1995 was relatively higher than that of 2005. This shows that vegetation health status in 1995 was relatively higher than vegetation health status in 2005 and the progress shows the decrease in vegetation health in the year of 2005.
The values of Normalized Difference Vegetation Index for both years were different. In 2015, the minimum and maximum NDVI was 0.050 and 0.557 respectively and for the year 2025, the obtained minimum and maximum value of NDVI was -0.074 and 0.620. This indicates that the vegetation health status in 2025 was relatively higher than that of 2015. So, there is the increased healthy vegetation in 2025.
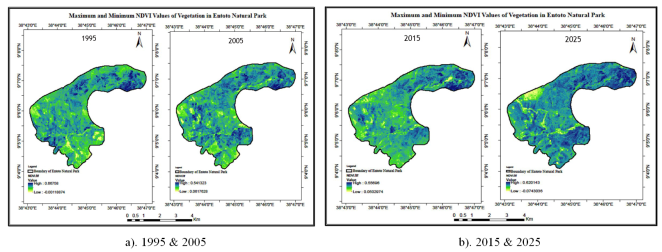
Figure 11. Map of the maximum and minimum NDVI values of vegetation during dry season.
Table 9. The NDVI values of vegetation in Entoto Natural Park during dry season.

Year

NDVI Values

Minimum

Maximum

1995

-0.001

0.668

2005

0.062

0.541

2015

0.050

0.557

2025

-0.074

0.620

Table 10. Interpretation of NDVI values in differentiating vegetation health status.

NDVI Values

Description

-1-0

Dead Vegetation

0-0.33

Diseased or infected vegetation

0.33-0.66

Moderately healthy vegetation

0.66-1

Very healthy vegetation

The vegetation health status for the years 1995 and 2005 were analysed based on the NDVI value of vegetation in Entoto Natural Park. The health status of the vegetation over the region was classified as very healthy vegetation, moderately healthy vegetation and diseased or infected vegetation. The dark green colour from the above map shows the area of land covered by dark green, very healthy vegetation. The colour nearest to dark green represents the area of land covered by moderately healthy vegetation in Entoto Natural Park. The dominant area is the land covered by moderately healthy vegetation for the year 1995 and 2005.
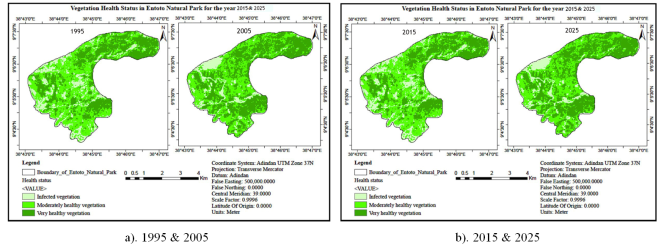
Figure 12. Map of vegetation health status in Entoto Natural Park during dry season.
The result of the analysis shows that the vegetation health status in North eastern part of Entoto Natural Park is relatively higher than the southern part of Entoto Natural Park for the year 2015 and 2025. Healthy green vegetation is found in large spatial coverage in North eastern part of Entoto Natural Park. Relatively less health vegetation is found in central and southern part of Entoto Natural Park for the year 2015. Also, for the year 2025, healthy green vegetation is found in large spatial coverage in North eastern and south eastern part of the study area while moderately healthy vegetation widely covers the central and southern part of Entoto Natural Park.
3.3.2. Vegetation Health Status in Wet Season
The analysis of spectral indices revealed that vegetation in Entoto Natural Park is healthier during the wet season compared to the dry season. This is because the wet season provides excess moisture in the soil, atmosphere, and vegetation leaves. The dominant vegetation in the park, Eucalyptus trees, showed good health during the wet season. However, there are still some infected Eucalyptus trees with low health status.
The analysis showed an increase in NDVI values during the wet season. Healthy vegetation exhibits good spectral reflectance in the near infrared region while absorbing the red part of the electromagnetic radiation.
During the wet season, the NDVI values of vegetation in Entoto Natural Park varied from 1995 to 2005. The minimum and maximum NDVI values for 1995 were 0.109 and 0.667 respectively. A high NDVI value indicates good vegetation health, while a low NDVI represents areas with poor health. For the year 2005, the minimum and maximum NDVI values were -0.018 and 0.811 respectively. The maximum NDVI value obtained in 2005 was relatively higher than that of 1995, indicating an improvement in vegetation health.
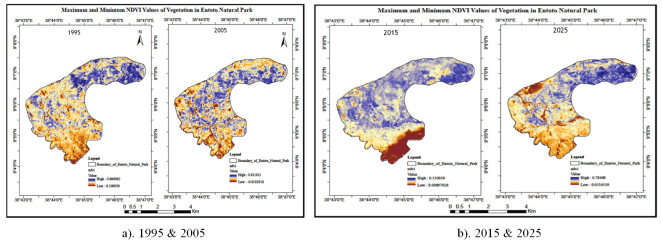
Figure 13. Map of the maximum and minimum NDVI values of vegetation during wet season.
Table 11. The NDVI values of vegetation in Entoto Natural Park during wet season.

Year

NDVI Values

Minimum

Maximum

1995

0.109

0.667

2005

-0.018

0.811

2015

0.006

0.510

2025

0.051

0.784

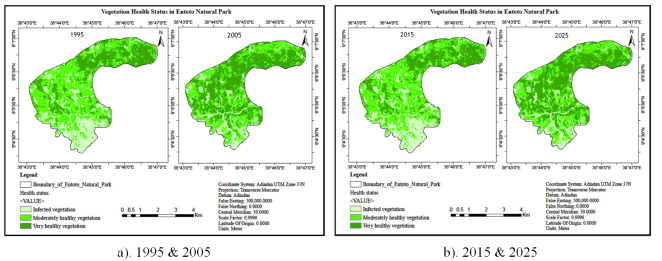
Figure 14. Map of vegetation health status in Entoto Natural Park during wet season.
The findings of the study conducted in Entoto Natural Park revealed that the dominant vegetation, specifically the eucalyptus trees, exhibited relatively high health status during the wet season. This was determined by employing the NDWI spectral index, which is commonly used to assess vegetation health status. The wet season is characterized by increased rainfall, resulting in higher soil moisture levels. This ample water supply ensures that plants have sufficient access to water, reducing water stress and promoting healthy growth.
Beyond the numerical trends, the spatial and temporal variations in NDVI, GNDVI, and NDWI can be interpreted in an ecological context. Areas of higher NDVI and GNDVI often correspond to zones with favourable soil properties, adequate moisture retention, and dense native vegetation, while lower values tend to occur in sparsely vegetated patches or regions with shallow soils and lower water availability. NDWI fluctuations particularly highlight the influence of seasonal precipitation and micro topography on leaf water content. Furthermore, the differing responses of NDVI and GNDVI across elevation gradients may reflect species-specific photosynthetic activity, with eucalyptus-dominated regions showing slightly lower chlorophyll activity than native vegetation. Integrating these environmental and species-related factors provides a more mechanistic understanding of vegetation health trends and supports the ecological plausibility of the 2050 projections.
3.4. Vegetation Health Status Prediction
This study presents the findings of a long-term vegetation health assessment conducted in Entoto Natural Park, Ethiopia, using spectral indices derived from satellite imagery, particularly NDVI, GNDVI, and NDWI, over a 30-year span from 1995 to 2025, with predictions extending to 2050. Data from both dry and wet seasons were utilized to enhance seasonal accuracy. Vegetation health conditions were classified into three categories for the 2050 prediction map: Infected vegetation, Moderately Healthy vegetation, and Very Healthy vegetation, based on established thresholds for NDVI, GNDVI, and NDWI corresponding to chlorophyll activity, leaf water content, and biomass.
Landsat imagery was pre-processed in ArcGIS, and Random Forest, a robust machine learning classifier available in the ENVI 5.3 extension tool, was applied to generate vegetation health maps, predicted maps, and validates the spectral classification. The model achieved an overall accuracy of 86.2% and a Cohen’s Kappa score of 0.812, indicating strong agreement with ground truth data. The confusion matrix revealed particularly accurate classification of Very Healthy vegetation, while minor misclassification occurred between Moderately Healthy and Infected vegetation due to spectral similarity in stressed or sparse vegetation.
Analysis of NDVI, GNDVI, and NDWI trends from 1995 to 2025 revealed a modest but consistent upward trajectory, indicating gradual ecological recovery and improved land management practices in the park. To extend this trend into the future, Random Forest regression models were applied to the historical dataset for each spectral index. The 2050 forecasts suggest favourable vegetation conditions, with NDVI values ranging from 0.65 to 0.75, corresponding to “Moderately Healthy” to “Very Healthy” vegetation. Similarly, GNDVI is projected to range between 0.55 and 0.70, reflecting enhanced chlorophyll concentration and photosynthetic activity, while NDWI is expected to fall within 0.45 to 0.60, indicating improved leaf water content and vegetation moisture retention.
These forecasts were visualized in trend charts, showing observed values from 1995–2025 and predicted values from 2026–2050, with shaded bands indicating vegetation health categories. The 2050 predicted vegetation health map shows that most of the park is projected to have Moderately Healthy to Very Healthy vegetation, with very few areas classified as infected, illustrating a positive long-term ecological trajectory.
Seasonal analysis confirmed that NDVI, GNDVI, and NDWI values were consistently higher during the wet season, highlighting the role of moisture availability in vegetation health and the importance of multi-seasonal monitoring. All observed and predicted values were compiled in an Excel dataset, including annual vegetation classification for each index, enabling long-term monitoring and reporting.
A cross-index interpretation further reinforces the ecological integrity of the results. NDVI, which reflects overall vegetation vigor, is inherently influenced by both chlorophyll efficiency and water availability directly represented by GNDVI and NDWI. The upward trend in GNDVI confirms strengthened photosynthetic performance, while the rise in NDWI indicates improved leaf moisture retention. These parallel increases in chlorophyll activity and water status jointly validate the observed NDVI improvement, demonstrating that the positive trajectory is ecologically driven rather than a mathematical artifact of the model. The coherent response of all three indices provides strong evidence of functional ecosystem recovery and supports the reliability of the 2050 vegetation forecast.
These results demonstrate that NDVI, GNDVI, and NDWI are effective indicators for vegetation health monitoring and forecasting. The upward trends in these indices and the projected expansion of “Very Healthy” vegetation provide a positive outlook for Entoto Natural Park’s ecosystem resilience. Moreover, this integrated approach establishes a practical framework for combining remote sensing, machine learning, and temporal forecasting to support sustainable land management and environmental planning. The 2050 predictions offer a baseline for proactive ecological decision-making and scenario modeling under future climate and land-use conditions.
However, it is important to note that the 2050 forecasts are based on the assumption that the underlying environmental and land management conditions observed between 1995 and 2025 will remain relatively stable. The Random Forest model extrapolates future vegetation health from historical spectral–ecological relationships and does not explicitly account for extreme climate anomalies, policy shifts, or accelerated urban expansion. Minor classification confusion between Moderately Healthy and Unhealthy classes further suggests sensitivity to spectral overlap in stressed vegetation. Although model performance is strong (OA 86.2%, Kappa 0.812), future work should incorporate scenario-based or sensitivity analysis to assess how predictions may shift under changing climate or anthropogenic pressures.
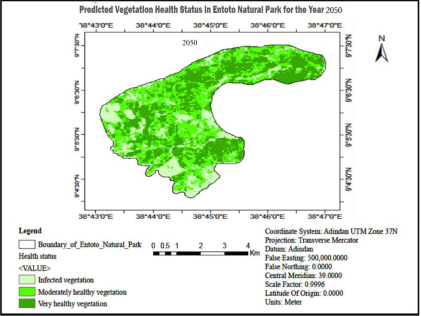
Figure 15. Map of Predicted vegetation health status in Entoto Natural Park.
The vegetation classification model developed for Entoto Natural Park using Random Forest and NDVI-based thresholds yielded a strong performance, with an overall accuracy of 86.2% and a Cohen’s Kappa score of 0.812. These metrics indicate a high level of agreement between the classified results and the reference ground truth data, confirming the model’s reliability in distinguishing different vegetation health conditions.
Table 12. Classification Accuracy for 2025. Classification Accuracy for 2025. Classification Accuracy for 2025.

Metric

Value

Overall Accuracy

86.20%

Cohen's Kappa

0.812

4. Conclusion and Recommendation
4.1. Conclusion
This study assessed vegetation condition in Entoto Natural Park using Landsat-derived spectral indices (NDVI, GNDVI, and NDWI) and Random Forest classification. The findings demonstrate that multispectral remote sensing combined with machine learning is effective for evaluating changes in vegetation greenness, chlorophyll concentration, and moisture status over time. The results show spatial variability in vegetation condition across the park, with healthier vegetation generally occurring in the upper highland and restoration zones, while lower and disturbed areas exhibited poorer conditions. The Random Forest classifier achieved reliable performance using the three spectral indices as input features, enabling accurate classification of vegetation condition and the prediction of future conditions based on observed trends.
The study fills an important gap in existing research by shifting the focus from land cover change to vegetation condition, and by introducing a practical, index-based assessment for a per-urban natural park. Although the Landsat spatial resolution limits fine-scale analysis, the approach provides a consistent and repeatable method for long-term monitoring. Overall, the study offers a useful geospatial framework that can support ecological restoration, management planning, and environmental monitoring efforts in Entoto Natural Park.
4.2. Recommendation
Based on these results, the following recommendations are proposed:
1. Strengthen ongoing restoration activities by prioritizing ecologically sensitive zones where vegetation condition remains poor, particularly lower slope areas and degraded patches.
2. Integrate spectral index–based vegetation monitoring into routine park management to track improvements in greenness, moisture levels, and overall ecosystem health.
3. Enhance management of eucalyptus-dominated areas, as these zones showed lower vegetation moisture and greenness compared to indigenous vegetation types.
4. Support long-term ecological planning by adopting geospatial tools and machine learning models, such as Random Forest, to forecast future vegetation conditions and guide restoration decisions and Collect higher-resolution field and elevation data in future studies to improve classification accuracy and to validate remote sensing–derived vegetation condition maps.
Abbreviations

DEM

Digital Elevation Model

ENP

Entoto Natural Park

GNDVI

Green Normalized Difference Vegetation Index

GIS

Geographic Information System

GPS

Global Positioning System

ML

Machine Learning

NDVI

Normalized Difference Vegetation Index

NDWI

Normalized Difference Water Index

OOB

Out-of-Bag (Random Forest Accuracy Metric)

RF

Random Forest

RMS

Root Mean Square

RS

Remote Sensing

UTM

Universal Transverse Mercator

USGS

United States Geological Survey

Author Contributions
Amanuel Wolde Selato: Data curation,Writing – original draft
Adamu Dessalegn Taddesse: Writing – original draft
Funding
This article has not been funded by any organizations or agencies. This independence ensures that the research is conducted with objectivity and without any external influence.
Data Availability Statement
The adequate resources of this article are publicly accessible. The data and materials used for analysis in this manuscript are available at the corresponding author. It is possible to reasonably request the corresponding author. Also, all secondary and primary data used for the research are available in the hands of researchers.
Conflicts of Interest
The authors declare no conflicts of interest.
References
[1] Almalki, R., Khaki, M., Saco, P. M., & Rodriguez, J. F. (2022). Monitoring and Mapping Vegetation Cover Changes in Arid and Semi-Arid Areas Using Remote Sensing Technology: A Review. In Remote Sensing (Vol. 14, Issue 20). MDPI.
[2] Jenbere, D., Lemenih, M., & Kassa, H. (2012). Expansion of Eucalypt Farm Forestry and Its Determinants in Arsi Negelle District, South Central Ethiopia. Small-Scale Forestry, 11(3), 389–405.
[3] Gil, L., Tolosana Esteban, E. (2010). Eucalyptus Species Management, History, Status and Trends in Ethiopia.
[4] Fikreyesus, D., Gizaw, S., Mayers, J., & Barrett, S. (2022). Country Report Mass tree planting Prospects for a green legacy in Ethiopia.
[5] Acharya, T. D., Subedi, A., & Lee, D. H. (2018). Evaluation of water indices for surface water extraction in a landsat 8 scene of Nepal. Sensors (Switzerland), 18(8).
[6] Croft, H., Arabian, J., Chen, J. M., Shang, J., & Liu, J. (2020). Mapping within-field leaf chlorophyll content in agricultural crops for nitrogen management using Landsat-8 imagery. Precision Agriculture, 21(4), 856–880.
[7] Daba, M. (2016). Miracle Tree: A Review on Multi-purposes of Moringa oleifera and Its Implication for Climate Change Mitigation. Journal of Earth Science & Climatic Change, 7(8).
[8] Darvishzadeh, R., Skidmore, A., Abdullah, H., Cherenet, E., Ali, A., Wang, T., Nieuwenhuis, W., Heurich, M., Vrieling, A., O’Connor, B., & Paganini, M. (2019). Mapping leaf chlorophyll content from Sentinel-2 and RapidEye data in spruce stands using the invertible forest reflectance model. International Journal of Applied Earth Observation and Geoinformation, 79, 58–70.
[9] TESEMA, A. D., & BERHAN, G. (2019). Assessment of biodiversity conservation in Entoto Natural Park, Ethiopia for ecotourism development. Asian Journal of Ethnobiology, 2(1).
[10] Serrano, J., Shahidian, S., & da Silva, J. M. (2019). Evaluation of normalized difference water index as a tool for monitoring pasture seasonal and inter-annual variability in a Mediterranean agro-silvo-pastoral system. Water (Switzerland), 11(1).
[11] Alvino, F. C. G., Aleman, C. C., Filgueiras, R., Althoff, D., & da Cunha, F. F. (2020). Vegetation indices for irrigated corn monitoring. Engenharia Agricola, 40(3), 322–333.
[12] Anjali, K., & Patil, K. A. (2021). NDVI: Vegetation Performance Evaluation using RS and GIS.
[13] Wayant, N. M., Maldonado, D., Rojas De Arias, A., Cousiño, B., & Goodin, D. G. (2018). Correlation between normalized difference vegetation index and malaria in a subtropical rain forest undergoing rapid anthropogenic alteration.
[14] Huang, S., Tang, L., Hupy, J. P., Wang, Y., & Shao, G. (2021a). A commentary review on the use of normalized difference vegetation index (NDVI) in the era of popular remote sensing. In Journal of Forestry Research (Vol. 32, Issue 1). Northeast Forestry University.
[15] Robinson, N. P., Allred, B. W., Jones, M. O., Moreno, A., Kimball, J. S., Naugle, D. E., Erickson, T. A., & Richardson, A. D. (2017). A dynamic landsat derived normalized difference vegetation index (NDVI) product for the conterminous United States. Remote Sensing, 9(8).
Cite This Article
  • APA Style

    Selato, A. W., Taddesse, A. D. (2026). Evaluation of Vegetation Conditions for Green Legacy Using Geospatial Technology: A Case of Entoto Natural Park, Addis Ababa, Ethiopia. Engineering Science, 11(1), 1-17. https://doi.org/10.11648/j.es.20261101.11

    Copy | Download

    ACS Style

    Selato, A. W.; Taddesse, A. D. Evaluation of Vegetation Conditions for Green Legacy Using Geospatial Technology: A Case of Entoto Natural Park, Addis Ababa, Ethiopia. Eng. Sci. 2026, 11(1), 1-17. doi: 10.11648/j.es.20261101.11

    Copy | Download

    AMA Style

    Selato AW, Taddesse AD. Evaluation of Vegetation Conditions for Green Legacy Using Geospatial Technology: A Case of Entoto Natural Park, Addis Ababa, Ethiopia. Eng Sci. 2026;11(1):1-17. doi: 10.11648/j.es.20261101.11

    Copy | Download

  • @article{10.11648/j.es.20261101.11,
      author = {Amanuel Wolde Selato and Adamu Dessalegn Taddesse},
      title = {Evaluation of Vegetation Conditions for Green Legacy Using Geospatial Technology: A Case of Entoto Natural Park, Addis Ababa, Ethiopia},
      journal = {Engineering Science},
      volume = {11},
      number = {1},
      pages = {1-17},
      doi = {10.11648/j.es.20261101.11},
      url = {https://doi.org/10.11648/j.es.20261101.11},
      eprint = {https://article.sciencepublishinggroup.com/pdf/10.11648.j.es.20261101.11},
      abstract = {Monitoring vegetation condition is essential for ecological sustainability, restoration planning, and climate change adaptation, particularly in urban-adjacent conservation areas such as Entoto Natural Park in Addis Ababa, Ethiopia. However, vegetation condition assessments in the park have been limited and lack quantitative evidence based on geospatial approaches. This study evaluates natural vegetation conditions using multispectral remote sensing, spectral indices, and a Random Forest machine learning model. Landsat imagery from 1995, 2005, 2015, and 2025 was processed to generate NDVI, GNDVI, and NDWI indices, which were used to classify vegetation health and analyze temporal trends. The Random Forest classifier was trained using field-based reference samples and validated using out-of-bag accuracy metrics. Results indicate a general improvement in vegetation condition between 1995 and 2025, with higher chlorophyll content and water availability in recently rehabilitated areas, while eucalyptus-dominated zones exhibited comparatively lower moisture and greenness values. The prediction model also forecasted future vegetation conditions, suggesting continued improvement under ongoing restoration programs. This study demonstrates the effectiveness of spectral indices combined with machine learning for vegetation condition monitoring and provides a geospatial foundation to support sustainable management and restoration efforts under Ethiopia’s Green Legacy Initiative.},
     year = {2026}
    }
    

    Copy | Download

  • TY  - JOUR
    T1  - Evaluation of Vegetation Conditions for Green Legacy Using Geospatial Technology: A Case of Entoto Natural Park, Addis Ababa, Ethiopia
    AU  - Amanuel Wolde Selato
    AU  - Adamu Dessalegn Taddesse
    Y1  - 2026/02/02
    PY  - 2026
    N1  - https://doi.org/10.11648/j.es.20261101.11
    DO  - 10.11648/j.es.20261101.11
    T2  - Engineering Science
    JF  - Engineering Science
    JO  - Engineering Science
    SP  - 1
    EP  - 17
    PB  - Science Publishing Group
    SN  - 2578-9279
    UR  - https://doi.org/10.11648/j.es.20261101.11
    AB  - Monitoring vegetation condition is essential for ecological sustainability, restoration planning, and climate change adaptation, particularly in urban-adjacent conservation areas such as Entoto Natural Park in Addis Ababa, Ethiopia. However, vegetation condition assessments in the park have been limited and lack quantitative evidence based on geospatial approaches. This study evaluates natural vegetation conditions using multispectral remote sensing, spectral indices, and a Random Forest machine learning model. Landsat imagery from 1995, 2005, 2015, and 2025 was processed to generate NDVI, GNDVI, and NDWI indices, which were used to classify vegetation health and analyze temporal trends. The Random Forest classifier was trained using field-based reference samples and validated using out-of-bag accuracy metrics. Results indicate a general improvement in vegetation condition between 1995 and 2025, with higher chlorophyll content and water availability in recently rehabilitated areas, while eucalyptus-dominated zones exhibited comparatively lower moisture and greenness values. The prediction model also forecasted future vegetation conditions, suggesting continued improvement under ongoing restoration programs. This study demonstrates the effectiveness of spectral indices combined with machine learning for vegetation condition monitoring and provides a geospatial foundation to support sustainable management and restoration efforts under Ethiopia’s Green Legacy Initiative.
    VL  - 11
    IS  - 1
    ER  - 

    Copy | Download

Author Information
  • Department of Surveying Engineering, Wachemo University, Hosanna, Ethiopia

  • Department of Surveying Engineering, Wachemo University, Hosanna, Ethiopia

  • Abstract
  • Keywords
  • Document Sections

    1. 1. Introduction
    2. 2. Methods and Materials
    3. 3. Result and Discussion
    4. 4. Conclusion and Recommendation
    Show Full Outline
  • Abbreviations
  • Author Contributions
  • Funding
  • Data Availability Statement
  • Conflicts of Interest
  • References
  • Cite This Article
  • Author Information